Monday Poster Session
Category: Colorectal Cancer Prevention
P1751 - A Comparison of Quality Metrics Between Gastroenterologists and Colorectal Surgeons Performing Screening Colonoscopy Within a Large Healthcare System


Shuji Mitsuhashi, MBBS
Thomas Jefferson University
Rochester, MN
Presenting Author(s)
1Thomas Jefferson University, Philadelphia, PA; 2Thomas Jefferson University Hospital, Philadelphia, PA
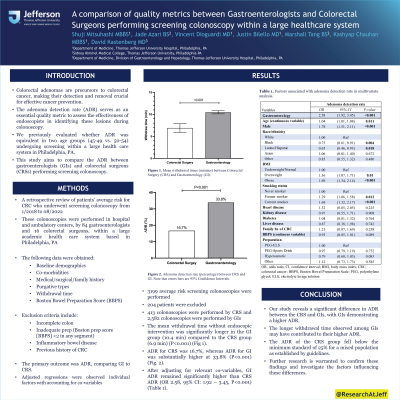
Introduction: Colorectal adenomas are precursors to colorectal cancer, making their detection and removal crucial for effective cancer prevention. The adenoma detection rate (ADR) serves as an essential quality metric to assess the effectiveness of endoscopists in identifying these lesions during colonoscopy. We previously evaluated whether ADR was equivalent in two age groups (45-49 vs. 50-54) undergoing screening within a large health care system in Philadelphia, PA. This study aims to compare the ADR between gastroenterologists (GIs) and colorectal surgeons (CRSs) performing screening colonoscopy.
Methods: This retrospective review analyzed average-risk patients aged 45-54 who underwent screening colonoscopy between 1/2018 and 08/2022, performed by 16 CRSs and 84 GIs. Demographics, co-morbidities, medical/surgical/family history, purgative, withdrawal time, and Boston score were collected. Exclusions were prior diagnoses of colorectal cancer or adenomatous polyps, inflammatory bowel disease, personal or family history of genetic cancer syndromes, incomplete colonoscopy, and inadequate bowel preparation. The primary outcome was ADR, comparing GI to CRS.
Results: 3,199 average-risk screening colonoscopies were performed, and 204 patients were subsequently excluded based on exclusion criteria, resulting in a final sample size of 2,995. Of these, 413 colonoscopies were performed by CRS and 2,582 colonoscopies were performed by GIs. The mean withdrawal time without endoscopic intervention was significantly longer in the GI group (10.4 min) compared to the CRS group (6.9 min) (P< 0.001) (Fig 1A). ADR for CRS was 16.7%, whereas ADR for GI was substantially higher at 33.8% (P< 0.001) (Fig. 1B). After adjusting for relevant co-variables, GI ADR remained significantly higher than CRS ADR (OR 2.58, 95% CI: 1.92 – 3.45, P< 0.001) (Table 1).
Discussion: Our study reveals a significant difference in ADR between the CRS and GIs, with GIs demonstrating a higher ADR. The longer withdrawal time observed among GIs may have contributed to their higher ADR. The ADR of the CRS group fell below the minimum standard of 25% for a mixed population as established by guidelines. Further research is warranted to confirm these findings and investigate the factors influencing these differences.

Table 1. Factors associated with adenoma detection rate in multivariate analysis.
| Adenoma detection rate | ||
Variables | OR | 95% CI | P-value |
Gastroenterology | 2.58 | (1.92, 3.45) | < 0.001 |
Age (continuous variable) | 1.04 | (1.01, 1.08) | 0.011 |
Male | 1.78 | (1.51, 2.11) | < 0.001 |
Race/ethnicity | |||
White | 1.00 | Ref | |
Black | 0.75 | (0.61, 0.91) | 0.004 |
Latino/Hispanic | 0.65 | (0.46, 0.93) | 0.018 |
Asian | 1.06 | (0.81, 1.40) | 0.672 |
Other | 0.85 | (0.55, 1.32) | 0.480 |
BMI | |||
Underweight/Normal | 1.00 | Ref | |
Overweight | 1.36 | (1.07, 1.71) | 0.01 |
Obese | 1.69 | (1.34, 2.14) | < 0.001 |
Smoking status | |||
Never smoker | 1.00 | Ref | |
Former smoker | 1.29 | (1.06, 1.58) | 0.012 |
Current smoker | 1.69 | (1.32, 2.17) | < 0.001 |
Heart disease | 1.32 | (0.85, 2.05) | 0.225 |
Kidney disease | 0.97 | (0.55, 1.71) | 0.908 |
Diabetes | 1.04 | (0.81, 1.32) | 0.764 |
Liver disease | 0.87 | (0.38, 1.98) | 0.742 |
Family history of CRC | 1.21 | (0.87, 1.69) | 0.258 |
BBPS (continuous variable) | 0.93 | (0.85, 1.01) | 0.089 |
Preparation | |||
PEG-ELS | 1.00 | Ref | |
PEG-Sports Drink | 0.97 | (0.79, 1.19) | 0.752 |
Hyperosmotic | 0.79 | (0.60, 1.03) | 0.083 |
Other | 1.12 | (0.73, 1.73) | 0.585 |
Disclosures:
Shuji Mitsuhashi, MBBS1, Jade Azari, BS1, Vincent Dioguardi, MD2, Justin Bilello, MD2, Marshall Tang, BS1, Kashyap Chauhan, MBBS1, David Kastenberg, MD1. P1751 - A Comparison of Quality Metrics Between Gastroenterologists and Colorectal Surgeons Performing Screening Colonoscopy Within a Large Healthcare System, ACG 2023 Annual Scientific Meeting Abstracts. Vancouver, BC, Canada: American College of Gastroenterology.

