Sunday Poster Session
Category: IBD
P0744 - Are We Meeting Celiac Disease Benchmarks in Inflammatory Bowel Disease Patients With Celiac Disease? Evaluation of Clinical, Serological, and Histological Characteristics: Case-Control Study From a Tertiary Referral Center


Jonathan Montrose, DO
Indiana University School of Medicine
Indianapolis, IN
Presenting Author(s)
1Indiana University School of Medicine, Indianapolis, IN; 2Indiana University, Indianapolis, IN; 3Indiana University Hospital, Indianapolis, IN
Introduction: A small portion of Inflammatory bowel disease (IBD) subjects have celiac disease (CeD). We conducted a retrospective case-control study to compare disease characteristics of subjects with IBD+ CeD versus CeD.
Methods: Patients were screened from January 2017 until June 2022 using appropriate ICD-10 codes for IBD and CeD. Data was collected including demographics, gluten-free diet (GFD) adherence patterns, celiac disease symptom index (CSI), serologic and histologic remission of CeD, from earliest available until time of administrative censoring.
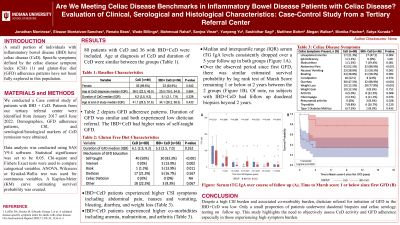
Results: 80 subjects with CeD and 36 subjects with IBD+ CeD were included. 70% of CeD and 64% of IBD+ CeD subjects were female (p=0.54). The median age at diagnosis of CeD in the CeD and IBD+ CeD subjects was similar. There was a higher rate of self-taught (83%), internet-taught (14%), or book-taught (14%) initiation of GFD in the IBD+ CeD group as compared to 50%, 0%, and 1% respectively in the CeD group (all p£0.01). Dietician referral was low in both groups (< 22%). The prevalence of the following components of the CSI were more frequently reported in IBD+ CeD: abdominal pain (89%), nausea and vomiting (58%), bloating (58%), diarrhea (89%), and weight loss (78%) when compared to 53%, 29%, 29%, 48%, and 13% in CeD, respectively (all p£0.01). Other significant co-morbidities that were notably more common in IBD+ CeD include unexplained anemia (47%), malnutrition (19%), arthritis (8%), and rheumatoid arthritis (RA) (8%) when compared to CeD group at 21%, 1%, 4%, 0%, respectively (p< 0.05). The median and IQR serum tTG IgA titers dropped consistently over a 5-year timeline in both groups (Fig 1a). Kaplan-Meir (KM) curves indicated a similar estimated survival probability by log rank test of Marsh Score remaining 1 or below at 2 years in the IBD+ CeD group when compared to CeD group (Fig 1b) (p=0.37) over the observed period of years since first GFD start date. No subjects with IBD+ CeD had follow-up duodenal biopsies beyond 2 years.
Discussion: Only 20% of IBD+ CeD were referred to a dietician for initiation of a GFD. Further, CSI burden and associated co-morbid conditions were higher in IBD+ CeD group. Very few IBD+ CeD underwent duodenal biopsy beyond two years and celiac serologies beyond 5 years. This study highlights the need for clinicians to objectively assess celiac disease activity and GFD adherence, especially in IBD+ CeD with high CSI symptom burden.

Variable | CeD | CeD+IBD | P-value |
Female | 55 (69.6%) | 23 (63.9%) | 0.542 |
Age at CeD diagnosis median (IQR) | 36.0 (22.0, 45.0) | 25.5 (19.0, 54.5) | 0.664 |
Duration of CeD median (IQR) | 6.2 (3.5, 9.2) | 5.1 (2.1, 7.9) | 0.228 |
Age at end of study median (IQR) | 41.1 (29.5, 51.6) | 34.1 (26.2, 58.3) | 0.433 |
Duration of GFD median (IQR) | 6.1 (2.9, 9.2) | 5.2 (2.5, 7.0) | 0.352 |
Mechanism of GFD Education, n (%) | |||
Self-taught | 40 (50.0%) | 30 (83.3%) | < 0.001 |
Internet | 0 (0%) | 5 (13.9%) | 0.002 |
Book | 1 (1.3%) | 5 (13.9%) | 0.011 |
Dietician | 17 (21.3%) | 6 (16.7%) | 0.567 |
Celiac Dietician | 0 (0%) | 0 (0%) |
|
Other | 18 (22.5%) | 3 (8.3%) | 0.067 |
CeD Symptoms Present, n (%) | |||
Unexplained anemia | 17 (21.3%) | 17 (47.2%) | 0.004 |
IgA Deficiency | 1 (1.3%) | 0 (0%) | 1.000 |
Malnutrition | 1 (1.3%) | 7 (19.4%) | 0.001 |
Abdominal Pain | 42 (52.5%) | 32 (88.9%) | < 0.001 |
Nausea/vomiting | 23 (28.8%) | 21 (58.3%) | 0.002 |
Bloating | 23 (28.8%) | 21 (58.3%) | 0.002 |
Constipation | 18 (22.5%) | 8 (22.2%) | 0.974 |
Diarrhea | 38 (47.5%) | 32 (88.9%) | < 0.001 |
Weight loss | 10 (12.5%) | 28 (77.8%) | < 0.001 |
Weight gain | 10 (12.5%) | 3 (8.3%) | 0.752 |
Arthritis | 4 (5.0%) | 8 (22.2%) | 0.008 |
Fibromyalgia | 2 (2.5%) | 4 (11.1%) | 0.074 |
Rheumatoid Arthritis | 0 (0%) | 3 (8.3%) | 0.028 |
Thyroiditis | 7 (8.8%) | 6 (16.7%) | 0.220 |
Type 1 DM | 6 (7.5%) | 1 (2.8%) | 0.433 |
Disclosures:
Jonathan Montrose, DO1, Eleazar E.. Montalvan-Sanchez, MD1, Renato Beas, MD2, Wade Billings, MD1, Mahmoud Rahal, MD1, Sanjna Vinze, MD, MPH1, Yunpeng Yu, BS2, Sashidhar Sagi, MD1, Matthew Bohm, DO3, Megan Walker, MD2, Monika Fischer, MD, MSc, FACG2, Satya Kurada, MD1. P0744 - Are We Meeting Celiac Disease Benchmarks in Inflammatory Bowel Disease Patients With Celiac Disease? Evaluation of Clinical, Serological, and Histological Characteristics: Case-Control Study From a Tertiary Referral Center, ACG 2023 Annual Scientific Meeting Abstracts. Vancouver, BC, Canada: American College of Gastroenterology.
