
Sunday Poster Session
Category: Small Intestine
Sarang Gupta, MD
University of Toronto
Toronto, ON, Canada
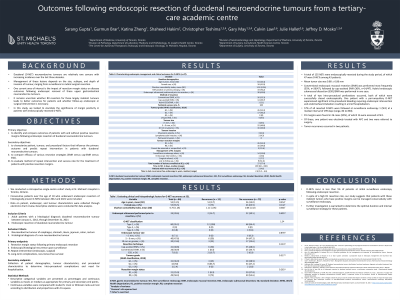
Variable | Value |
Baseline demographics | |
| Age in years, mean (SD) | 64 (10.4) |
| Female sex, n (%) | 18 (41.9) |
| Charlson comorbidity index, mean (SD) | 1.59 (2.26) |
| NET positive on previous biopsy, n (%) | 33 (70.2) |
| Endoscopic ultrasound performed prior to resection, n (%) | 30 (63.8) |
Method of resection | |
| Conventional EMR, n (%) | 26 (55.3) |
| Cap-assisted EMR, n (%) | 14 (29.7) |
| Hybrid ESD/EMR, n (%) | 1 (2.1) |
Technical success rate, % | 100 |
| Tumor grade (WHO classification, 2019) | |
| G1, n (%) | 26 (55.3) |
| G2, n (%) | 17 (36.2) |
| G3, n (%) | 0 (0) |
| Unspecified, n (%) | 4 (8.5) |
Tumor size | |
| < 5 mm, n (%) | 4 (8.5) |
| 5 – 9 mm, n (%) | 22 (46.8) |
| > 10 mm or greater, n (%) | 16 (34.0) |
| Unspecified, n (%) | 5 (10.6) |
| Tumor invasion | |
| Muscularis propria, n (%) | 3 (6.4) |
| Lymphovascular invasion, n (%) | 2 (4.3) |
| Perineural invasion, n (%) | 0 (0) |
Tumor resection margins | |
| R1, n (%) | 26 (55.3) |
| R0, n (%) | 16 (34.0) |
| Cannot be assessed or unspecified, n (%) | 5 (10.6) |
Total number lesions surveilled at SE1, n (%) | 27 (57.4) |
Time to SE1 in days, median (range) | 199 (84 – 830) |
| Management of R1 margins | |
| Surveillance endoscopy alone, n (%) | 14 (53.8) |
| Endoscopic intervention, n (%) | 1 (3.8) |
| Surgical referral, n (%) | 2 (7.7) |
| Lost to follow-up, n (%) | 9 (34.6) |
Patients with recurrence at SE1, n (%) | 2 (4.6) |
| Time to last recurrence-free endoscopy in years, median (range) | 2.6 (0.4 – 6.6) |