Tuesday Poster Session
Category: IBD
P3613 - Examination of Dysplasia and Cancer Surveillance Compliance With Guidelines Among Pediatric Onset Inflammatory Bowel Disease at a Tertiary Referral Center

- MI
Meera Iyengar, MD
Indiana University School of Medicine
Indianapolis, IN
Presenting Author(s)
1Indiana University School of Medicine, Indianapolis, IN; 2Indiana University Hospital, Indianapolis, IN
Introduction: Inflammatory bowel disease (IBD), specifically Crohn’s Disease (CD) and Ulcerative Colitis (UC), results in an increased risk of colorectal cancer. This risk increases with disease duration and severity and thus, those diagnosed in childhood are at high risk for dysplasia1. It has not been studied whether those diagnosed with IBD in childhood are being surveilled per guidelines. Our aim was to determine compliance in patients with pediatric onset IBD with guideline-recommended colonoscopy surveillance.
Methods: This is a retrospective cohort study conducted using data obtained from patients in the Indiana University pediatric IBD patient registry. Individuals aged 10-30 years who were seen by a gastroenterologist between 1/2012-12/2021, had Crohn’s colitis involving more than 1/3 of their colon or UC proximal the rectum, and had ten years of follow-up were included. Patient demographics, age at diagnosis, disease severity, medication use and data around expected time of dysplasia screening were collected.
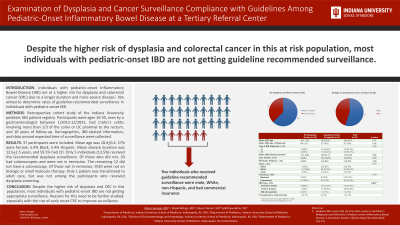
Results: 37 participants were included in the study. Their mean age was 18.4+0.4, 27% were female, 5.4% were Black, and 5.4% Hispanic. The mean disease duration was 12.6+2.5 years, and 59.5% patients had CD. Only five subjects (13.5%) received the recommended dysplasia surveillance, and four of five had UC (p=0.047). Of those who did not get dysplasia surveillance, 20 had colonoscopies to evaluate disease activity and were not in remission. The remaining 12 patients did not have any colonoscopy done during the recommended time frame. Of those not in remission, 9/20 were not on a biologic or small molecule therapy despite not being in endoscopic remission. Only one patient was transitioned to adult care, but was not among the participants who received dysplasia screening.
Discussion: Despite the higher risk of dysplasia and colorectal cancer in this at risk population, most of those with pediatric onset IBD and cared for by pediatric gastroenterologists are not getting guideline recommended surveillance. The reasons for this are unclear, and needs to be further studied especially with the rise of early onset colorectal cancer to improve surveillance.
- Aardoom MA, Joosse ME, de Vries ACH, Levine A, de Ridder L. Malignancy and Mortality in Pediatric-onset Inflammatory Bowel Disease: A Systematic Review. Inflamm Bowel Dis 2018;24(4):732-741.
| Dysplasia Screen Completed (n=5) | No Dysplasia Screen (n=32) | Total (n=37) | p-value |
Mean (SD) Age | 19.1 (1.2) | 18.3 (2.8) | 18.4 (2.7) | 0.41 |
Mean (SD) Age at Diagnosis | 6.4 (1.1) | 5.7 (3.2) | 5.7 (3.0) | 0.35 |
Age at IBD Diagnosis, n (%) < 6 > 6 |
3 (60%) 2 (40%) |
21 (65.6%) 11 (34.3%) |
24 (64.9%) 13 (35.1%) | 0.59 |
Mean (SD) Disease Duration | 12.7 (0.9) | 12.6 (2.7) | 12.6 (2.5) | 0.52 |
Sex: female, n (%) | 0 (0%) | 10 (31.2%) | 10 (27%) | 0.16 |
Ethnicity: Hispanic, n (%) | 0 (0%) | 2 (6.2%) | 2 (5.4%) | 0.90 |
Race, n (%) Black White Asian |
0 (0%) 5 (100%) 0 (0%) |
2 (6.2%) 28 (87.5%) 2 (6.2%) |
2 (5.4%) 33 (89.2%) 2 (5.4%) | 0.77* |
Insurance, n (%) Medicaid Commercial |
0 (0%) 5 (100%) |
8 (25%) 24 (75%) |
8 (21.6%) 29 (78.4%) | 0.24 |
IBD Type, n (%) Ulcerative Colitis Crohn’s Disease IBD-Unclassified |
4 (80%) 1 (20%) 0 (0%) |
10 (31.2%) 21 (65.6%) 1 (3.1%) |
14 (37.8%) 22 (59.5%) 1 (2.7%) | 0.047** |
Disclosures:
Meera Iyengar, MD1, Wade Billings, MD1, Matthew Bohm, DO2. P3613 - Examination of Dysplasia and Cancer Surveillance Compliance With Guidelines Among Pediatric Onset Inflammatory Bowel Disease at a Tertiary Referral Center, ACG 2023 Annual Scientific Meeting Abstracts. Vancouver, BC, Canada: American College of Gastroenterology.
