Tuesday Poster Session
Category: Practice Management
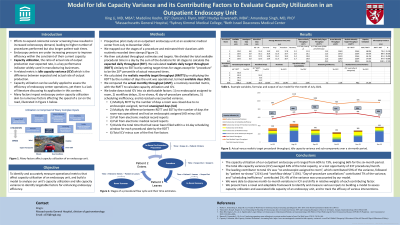
P4085 - Model for Idle Capacity Variance and Its Contributing Factors to Enhance Capacity Utilization in an Outpatient Endoscopy Unit
Tuesday, October 24, 2023
10:30 AM - 4:00 PM PT
Location: Exhibit Hall

Has Audio

Xing Li, MD, MBA
Massachusetts General Hospital
Boston, MA
Presenting Author(s)
Xing Li, MD, MBA1, Madeline Koehn, BS2, Duncan J. Flynn, MD3, Hrudya Viswanadh, MBA1, Amandeep Singh, MD, PhD1
1Massachusetts General Hospital, Boston, MA; 2Sydney Kimmel Medical College, Philadelphia, PA; 3Beth Israel Deaconess Medical Center, Boston, MA
Introduction: High endoscopic volumes and prolonged wait times, especially following the COVID-19 pandemic, place significant strain on endoscopy centers to improve efficiency. Many factors affect endoscopy suite capacity utilization. Little has been described in the literature about analyzing capacity variance (difference between actual and expected volume). We present our pilot experience building a model inputting routinely captured metrics to analyze capacity variance and identify targetable factors for enhancing endoscopy efficiency.
Methods: We examined recorded procedural throughput and flow times at our outpatient endoscopy unit from July to December 2022. We defined realistic targets by analysis of measured flow times. For each month, we benchmarked the actual throughput against realistic target throughout. We defined idle capacity variance as the difference between the two. We broke down total idle capacity variance into 5 attributable factors: 1) no endoscopist assigned to room, 2) workflow delays, 3) no-shows, 4) day-of-procedure cancellations after patient assessment, and 5) residual unaccounted variance.
Results: For the six-month study period, the actual monthly unit throughput ranged from 567 to 717, averaging 657 procedures. Based on average measured room turnover, sedation, procedural and recovery times, the expected daily throughput averaged 45 procedures. Setting target flow times as 20th percentile of each month’s recorded flow times, the daily realistic target throughput averaged 47 procedures. Our model calculated an average monthly realistic target throughput of 994 procedures. Our capacity utilization averaged 66%, and the idle capacity variance averaged 337 procedures per month (34%). The contributing factors to the total variance included no endoscopist assigned to room (53%), workflow delays (13%), no-shows (21%), day-of-procedure cancellations after patient assessment (7%), with the rest being residual unaccounted variance (6%). We were also able to see month-by-month variations in total idle capacity variance as well as the relative weights of each contributing factor.
Discussion: We built a model to benchmark our current monthly procedural throughput against a realistic target throughput, and found that our idle capacity averaged 34%, largely due to rooms not assigned to any endoscopist. Our model allowed us to identify and target the sources of variance leading to low capacity utilization, and could be iterated to track effects of specific interventions.

Disclosures:
Xing Li, MD, MBA1, Madeline Koehn, BS2, Duncan J. Flynn, MD3, Hrudya Viswanadh, MBA1, Amandeep Singh, MD, PhD1. P4085 - Model for Idle Capacity Variance and Its Contributing Factors to Enhance Capacity Utilization in an Outpatient Endoscopy Unit, ACG 2023 Annual Scientific Meeting Abstracts. Vancouver, BC, Canada: American College of Gastroenterology.
1Massachusetts General Hospital, Boston, MA; 2Sydney Kimmel Medical College, Philadelphia, PA; 3Beth Israel Deaconess Medical Center, Boston, MA
Introduction: High endoscopic volumes and prolonged wait times, especially following the COVID-19 pandemic, place significant strain on endoscopy centers to improve efficiency. Many factors affect endoscopy suite capacity utilization. Little has been described in the literature about analyzing capacity variance (difference between actual and expected volume). We present our pilot experience building a model inputting routinely captured metrics to analyze capacity variance and identify targetable factors for enhancing endoscopy efficiency.
Methods: We examined recorded procedural throughput and flow times at our outpatient endoscopy unit from July to December 2022. We defined realistic targets by analysis of measured flow times. For each month, we benchmarked the actual throughput against realistic target throughout. We defined idle capacity variance as the difference between the two. We broke down total idle capacity variance into 5 attributable factors: 1) no endoscopist assigned to room, 2) workflow delays, 3) no-shows, 4) day-of-procedure cancellations after patient assessment, and 5) residual unaccounted variance.
Results: For the six-month study period, the actual monthly unit throughput ranged from 567 to 717, averaging 657 procedures. Based on average measured room turnover, sedation, procedural and recovery times, the expected daily throughput averaged 45 procedures. Setting target flow times as 20th percentile of each month’s recorded flow times, the daily realistic target throughput averaged 47 procedures. Our model calculated an average monthly realistic target throughput of 994 procedures. Our capacity utilization averaged 66%, and the idle capacity variance averaged 337 procedures per month (34%). The contributing factors to the total variance included no endoscopist assigned to room (53%), workflow delays (13%), no-shows (21%), day-of-procedure cancellations after patient assessment (7%), with the rest being residual unaccounted variance (6%). We were also able to see month-by-month variations in total idle capacity variance as well as the relative weights of each contributing factor.
Discussion: We built a model to benchmark our current monthly procedural throughput against a realistic target throughput, and found that our idle capacity averaged 34%, largely due to rooms not assigned to any endoscopist. Our model allowed us to identify and target the sources of variance leading to low capacity utilization, and could be iterated to track effects of specific interventions.

Figure: The height of the vertical bars represents total idle capacity variance, which is the difference between total realistic target procedural throughput and actual procedural throughput by month. Each bar is further broken down into five contributing factors, specified in the legend below the graph.
Disclosures:
Xing Li indicated no relevant financial relationships.
Madeline Koehn indicated no relevant financial relationships.
Duncan Flynn indicated no relevant financial relationships.
Hrudya Viswanadh indicated no relevant financial relationships.
Amandeep Singh: Allurion Technologies – Advisor or Review Panel Member.
Xing Li, MD, MBA1, Madeline Koehn, BS2, Duncan J. Flynn, MD3, Hrudya Viswanadh, MBA1, Amandeep Singh, MD, PhD1. P4085 - Model for Idle Capacity Variance and Its Contributing Factors to Enhance Capacity Utilization in an Outpatient Endoscopy Unit, ACG 2023 Annual Scientific Meeting Abstracts. Vancouver, BC, Canada: American College of Gastroenterology.
