Sunday Poster Session
Category: Esophagus
P0416 - Higher Prevalence of Allergic Comorbidities in Children With Eosinophilic Esophagitis Compared to Adults in the United States: A Population-Based Study

- TQ
Thabet Qapaja, MD
Cleveland Clinic
Cleveland, OH
Presenting Author(s)
1Cleveland Clinic, Cleveland, OH; 2Cleveland Clinic Foundation, Cleveland, OH
Introduction: Eosinophilic esophagitis (EoE) is a chronic immune-mediated esophageal disease characterized by symptoms related to esophageal dysfunction and eosinophil-predominant inflammation. EoE is increasing in prevalence with varied clinical manifestations among the adult and pediatric populations. We aimed to study the demographics, presenting symptoms, and allergic comorbidities of patients diagnosed with EoE between the years 2017-2022.
Methods: We queried a commercial database (Explorys Inc, Cleveland, OH), an aggregate of electronic health record data from 26 major integrated US healthcare systems from 2017 to 2022. Based on Systematized Nomenclature of Medicine – Clinical Terms (SNOMED-CT), we identified all patients with a diagnosis of EoE. We then calculated the prevalence of EoE and its associated symptoms and conditions among adult and pediatric populations. Statistical analysis was performed using Statistical Package for Social Sciences (SPSS version 25, IBM Corp). For all analyses, a 2-sided P value < 0.05 was considered statistically significant.
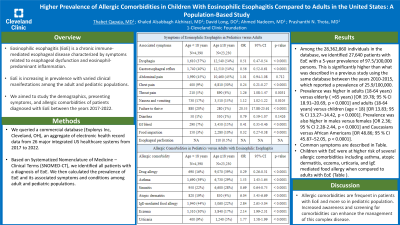
Results: Among the 28,362,860 individuals in the database between the years 2017 to 2022, we identified 27,640 patients with EoE with a 5-year prevalence of 97.5/100,000 persons. This is significantly higher than what was described in a previous study using the same database between the years 2010-2015, which reported a prevalence of 25.9/100,000. Prevalence was higher in adults (18-64 years) versus elderly ( >65 years) [OR 19.78; 95 % CI 18.91–20.69, p < 0.0001] and adults (18-64 years) versus children (age < 18) [OR 13.83; 95 % CI 13.27–14.42, p < 0.0001]. Prevalence was also higher in males versus females [OR 2.36; 95 % CI 2.28-2.44, p < 0.0001] and Caucasians versus African Americans [OR 48.86; 95 % CI 45.87–52.05, p < 0.0001]. Common symptoms are described in Table 1. Children with EoE were at higher risk of several allergic comorbidities including asthma, atopic dermatitis, eczema, urticaria, and IgE mediated food allergy when compared to adults with EoE (Table 1).
Discussion: Allergic comorbidities are frequent in patients with EoE and more so in pediatric population. Increased awareness and screening for comorbidities can enhance the management of this complex disease.
Symptoms of Eosinophilic Esophagitis in Pediatrics versus Adults | |||||
Associated symptoms | Age < 18 years N=4,390 | Age ≥18 years N=23,230 | OR | 95% CI | p-value |
Dysphagia | 1,610 (37%) | 12,540 (54%) | 0.51 | 0.47-0.54 | < 0.0001 |
Gastroesophageal reflux | 1,740 (40%) | 12,510 (54%) | 0.56 | 0.52-0.61 | < 0.0001 |
Abdominal pain | 1,990 (45%) | 10,460 (45%) | 1.01 | 0.94-1.08 | 0.712 |
Chest pain | 400 (9%) | 6,810 (30%) | 0.24 | 0.21-0.27 | < 0.0001 |
Throat pain | 210 (5%) | 890 (4%) | 1.26 | 1.08-1.47 | 0.0031 |
Nausea and vomiting | 730 (17%) | 3,510 (15%) | 1.12 | 1.02-1.22 | 0.0105 |
Failure to thrive | 880 (20%) | 280 (1%) | 20.55 | 17.88-23.61 | < 0.0001 |
Diarrhea | 50 (1%) | 330 (1%) | 0.79 | 0.59-1.07 | 0.1426 |
GI bleed | 290 (7%) | 3,450 (15%) | 0.41 | 0.35-0.46 | < 0.0001 |
Food impaction | 150 (3%) | 2,280 (10%) | 0.32 | 0.27-0.38 | < 0.0001 |
Esophageal perforation | NA | 110 (0.5%) | NA | NA | NA |
Allergic Comorbidities in Pediatrics versus Adults with Eosinophilic Esophagitis | |||||
Allergic comorbidity | Age < 18 years N=4,390 | Age ≥18 years N=23,230 | OR | 95% CI | p-value |
Drug allergy | 690 (16%) | 9,070 (39%) | 0.29 | 0.26-0.31 | < 0.0001 |
Asthma | 1,690 (39%) | 6,730 (29%) | 1.53 | 1.43-1.64 | < 0.0001 |
Sinusitis | 950 (22%) | 6,600 (28%) | 0.69 | 0.64-0.75 | < 0.0001 |
Atopic dermatitis | 820 (19%) | 850 (4%) | 6.04 | 5.45-6.69 | < 0.0001 |
IgE-mediated food allergy | 1,940 (44%) | 5,060 (22%) | 2.84 | 2.65-3.04 | < 0.0001 |
Eczema | 1,310 (30%) | 3,840 (17%) | 2.14 | 1.99-2.31 | < 0.0001 |
Urticaria | 400 (9%) | 1,240 (5%) | 1.77 | 1.58-1.99 | < 0.0001 |
Disclosures:
Thabet Qapaja, MD1, Khaled Alsabbagh Alchirazi, MD1, David Long, DO1, Ahmed Nadeem, MD1, Prashanthi N. Thota, MD2. P0416 - Higher Prevalence of Allergic Comorbidities in Children With Eosinophilic Esophagitis Compared to Adults in the United States: A Population-Based Study, ACG 2023 Annual Scientific Meeting Abstracts. Vancouver, BC, Canada: American College of Gastroenterology.
