Monday Poster Session
Category: Liver
P2348 - Simplified Prognostic Model for Predicting First 15 Days Mortality in Alcoholic Acute on Chronic Liver Failure Patients


Sunil Kumar Dadhich, MD, PhD, FACG
SN Medical College
Jodhpur, Rajasthan, India
Presenting Author(s)
SN Medical College, Jodhpur, Rajasthan, India
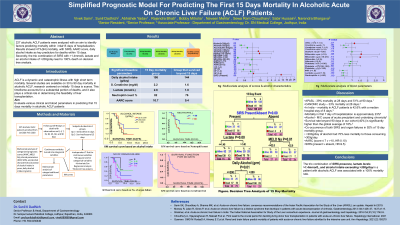
Introduction: ACLF is a dynamic and catastrophic illness with high short term mortality. While several studies have focused on prognosticating the 30- to 90-day mortality in ACLF, the early mortality within the first 15 days has received limited attention,although this period also contribute significant chunk of deaths. Hence we aim to evaluate the same in alcoholic ACLF patients.
Methods: Clinical and biochemical blood parameters of 227 alcoholic ACLF patients were collected during a period of Jan2021-Feb 2023.These patients were followed up until either 90 days or death. Data points were collected at multiple time intervals at 0, 4, 7, 15, 30, 45, 60, and 90 days. Statistical analysis was performed focusing on 15 day mortality and comparing with those who survived beyond 15 days.
Results: Of 227 patients, 27% (62) died within7 days, 41% (94) within 15 days, 53% (121) within 30 days and 60% (136) within 90 days while 40% (91) survived beyond 90 days. Comparison of baseline means of 15 day mortality versus survived showed statistically significant difference in daily alcohol intake ( 198g v 144g, p=.01), serum creatinine (2.2 v 1.6, p-0.04), lactate (2.8 v 1.8, p<0.00), neutrophil counts (82% v 76%, p<0.00), MELDNa score (33 v 30,p-0.005), AARC score (10.7 v 9.4,p< .00). Chi square test indicated significant association of SIRS, HE, NOF with mortality.
Uni-variant Cox regression revealed significant hazards ratio of lactate (p-.000,HR-1.91), creatinine (p-.003,HR-1.17), daily alcohol intake (p-.00, HR-1.003), neutrophils (p-.000,HR-1.052), NOF (p-000,HR-1.674), SIRS ( p-0.000,HR-10.6), AARC score (p-0.000,HR-1.251), MELDNa score (p-0.01,HR-1.037) on 15 day mortality. Multi-variant cox regression of categorical blood parameters showed that creatinine < 0.7 mg/dl had 56% less mortality (p-0.004, HR - 0.44) than creatinine >1.5mg/dl, INR < 1.8 had 53% less mortality (p-0.02,HR-0.47)than INR >1.8, lactate < 1.8 had 58% less mortality (p-< .00,HR-0.42) than lactate >1.8 and neutrophil counts < 80% had 57% less mortality (p-< 0.00, HR-0.43). Those consuming < 200g/day of alcohol had 70% less mortality to those with >300g/day.Among the prognostic scores, only AARC (score ≤ 7 v >10, p-0.03, HR-0.10) and SIRS (present v absent, p-< 0.00, HR-9.5) showed significant results.
Discussion: Conclusions: Patients with alcoholic ACLF have a high early 15 Day mortality and the SIRS, AARC score and daily amount of alcohol intake hold the key in prognosticating the same.

Compilation of Positive results | ||||
Independent T-Test | ||||
Variable | Means ± S.D | P value | ||
| Mortality upto 15 Days | Survived beyond 15 Days |
| |
Creatinine | 2.21 | 1.6 | 0.04 | |
Lactate | 2.8 | 1.8 | 0.00 | |
Neutrophils % | 82 | 76 | 0.00 | |
Daily alcohol intake (g) | 198 | 144 | 0.01 | |
MELD Na | 32 | 30 | 0.05 | |
AARC score | 10.7 | 9.4 | 0.00 | |
Chi-Square Test | ||||
• Statistically significant relationship between SIRS and Event (Mortality within 15days v Survival beyond 15 Days), X2 (1) = 54.7, p =0 .00 • Statistically significant relationship between Number of Organ failure and Event (Mortality within 15days v Survival beyond 15 Days), X2 (3) = 23.93, p =0 .00 | ||||
Univariate Cox Regression Analysis | ||||
| HR | P-Value | ||
Lactate | 1.91 | < 0.05 | ||
Creatinine | 1.17 | 0.003 | ||
Daily Alcohol Intake | 1.003 | < 0.05 | ||
Neutrophils | 1.052 | < 0.05 | ||
NOF | 1.67 | < 0.05 | ||
SIRS | 10.6 | < 0.05 | ||
AARC score | 1.25 | < 0.05 | ||
MELDNa score | 1.04 | 0.01 | ||
Multivariate Cox Regression Analysis of Categorical Blood Parameters | ||||
Categorical Blood Parameters | HR | P value | ||
Creatinine < 0.7mg/dl compared to creatinine >1.5mg/dl | 0.44 | 0.004 | ||
INR < 1.8 compared to INR >1.8, | 0.47 | 0.02 | ||
lactate < 1.8 mmol/L compared to lactate >1.8 mmol/L | 0.43 | < 0.05 | ||
Neutrophil counts < 80% compared to counts >80% | 0.43 | < 0.05 | ||
Multivariate Cox Regression of Non Blood Parameters | ||||
Non Blood Parameters | HR | P value | ||
Alcohol intake < 200g/day compared to >300g/day. | 0.28 | < 0.05 | ||
AARC score ≤ 7 compared to >10 | 0.10 | 0.03 | ||
SIRS (present v absent) | 9.5 | < 0.05 | ||
ROC Curve | ||||
Variables | Area | |||
Daily amt of alcohol in gm | .580 | |||
Creatinine (mg/dl) | .637 | |||
AARC Score | .702 | |||
No of Organ failure | .656 | |||
Lactate | .687 | |||
Neutrophils (%) | .674 | |||
Disclosures:
Vivek Saini, MD, Sunil Kumar Dadhich, MD, PhD, FACG, Narendra Bhargava, MD, Sabir Hussain, MD, Sewaram Chaudhary, MD. P2348 - Simplified Prognostic Model for Predicting First 15 Days Mortality in Alcoholic Acute on Chronic Liver Failure Patients, ACG 2023 Annual Scientific Meeting Abstracts. Vancouver, BC, Canada: American College of Gastroenterology.
